Floor Tape Store
Showing posts with label Visual Factory. Show all posts

Monday, April 19, 2021

The Benefits of Lean Visual Project Management


One of the greatest and most important challenges of project management is communicating clearly with your team about both the details and the big picture of your project. After all, it’s unlikely people will work on the right things in the right order if they don’t understand how each task– and its timely completion– contributes to the success of the project. One of the best ways to communicate with your team is via visual project management.

Visual project management is a method by which you can organize and visualize process over traditional projects and utilizing tools to help everyone involved visualize the status and needs of the project.

There are many benefits of visual management:

  • Save time by simplifying the complex – Visual management helps people understand complex information at a glance, like what work items should be prioritized and who should be working on them.
  • Reduce waste by communicating effectively – Take the guesswork out of teamwork by having a shared, common view of all work being done across the team.
  • Overcome impediments to flow – See where work has slowed or stopped by creating a Lean visual management board that enables you to see bottlenecks and blockers.
  • Collaborate and improve – Instead of pushing work blindly into team members’ queues, you can move work through our team process with a better understanding of capacity. This enables teams to collaborate in a healthier, more productive way.

Visual project management tools help bring the information to life, connecting the dots and painting a clear picture of the desired outcome, the current status, and any roadblocks that may be in the way. Visual management becomes a language that everyone can understand and explain.
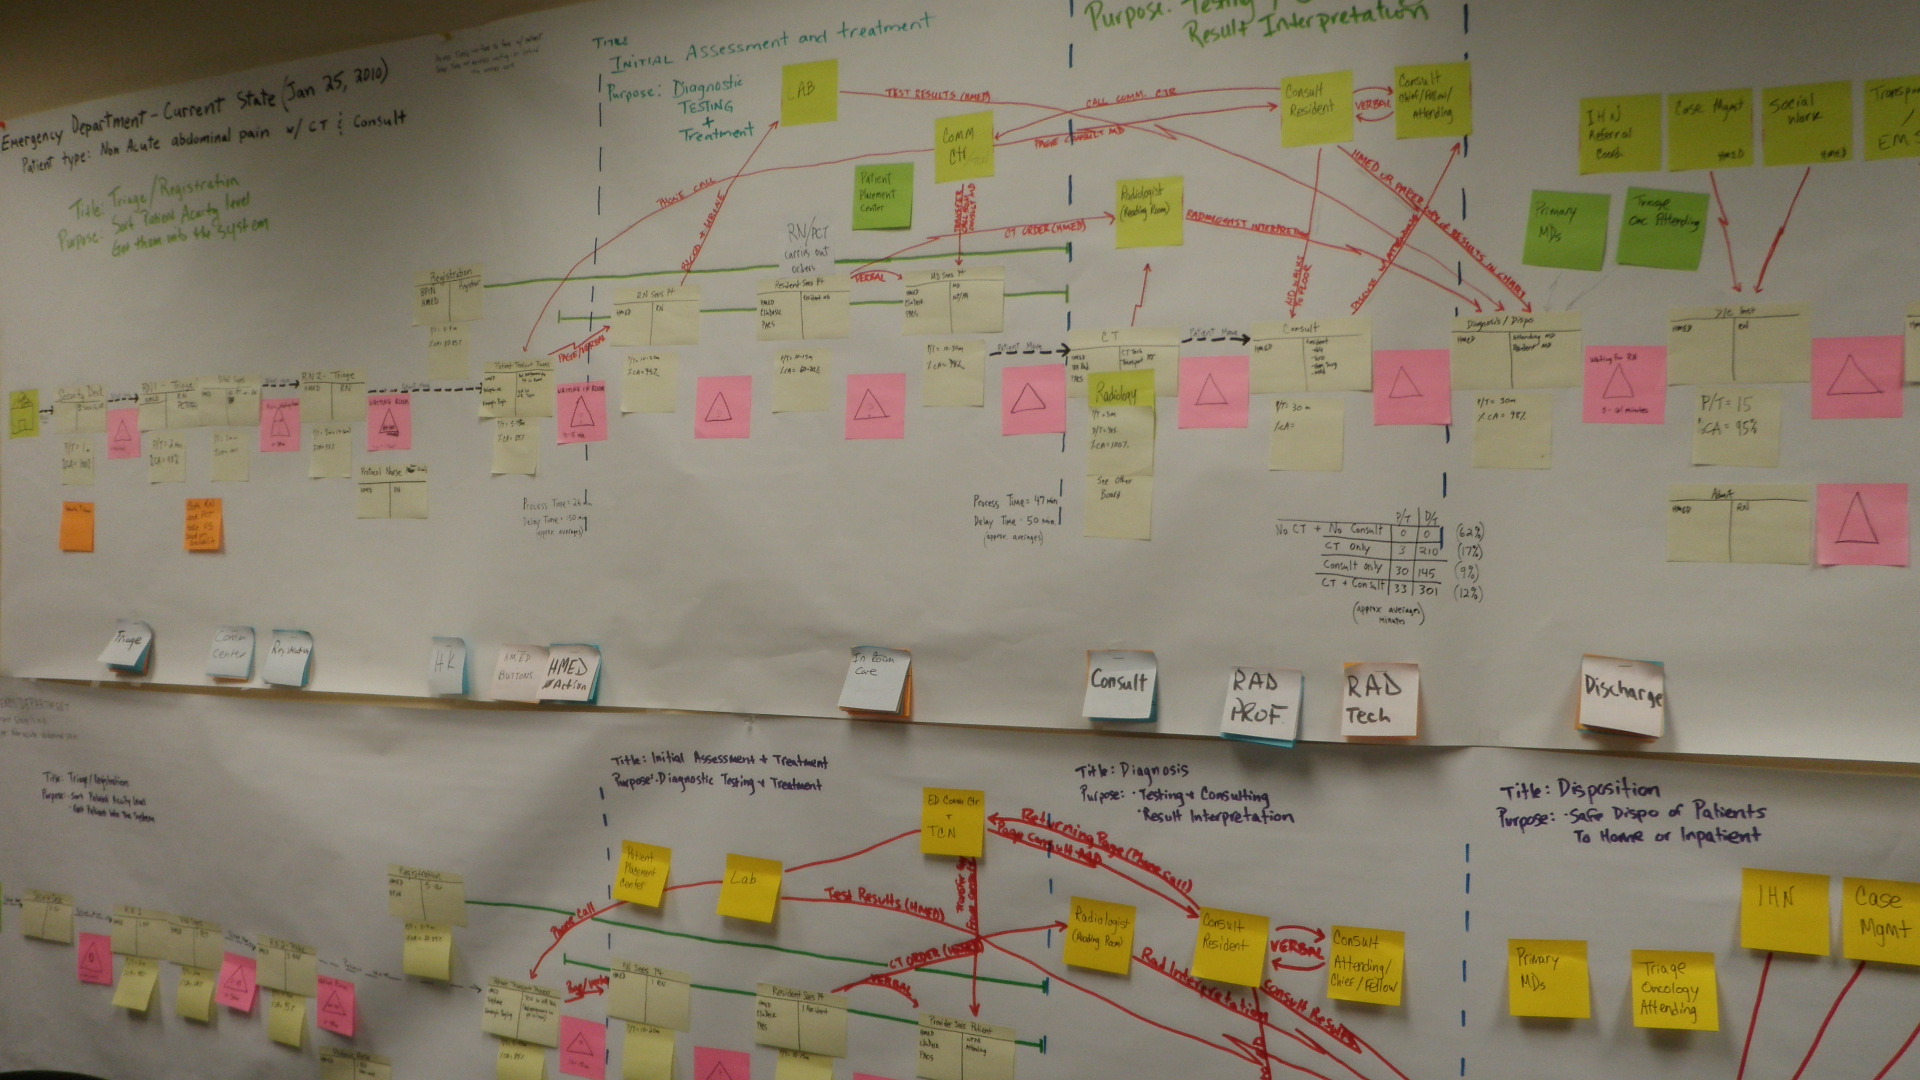
A visual management board can help see the big picture, structure project activities, monitor and improve a team’s performance. Having a project board showing all the project tasks, their stage in the project life at any given moment can help significantly improve communication between team members.

More specifically, it enables the team to visualize the system, become aware of any constraints or roadblocks that might result, and begin a dialog on how to solve those problems. In this way, the challenges are directed to the system and how to solve versus focusing on the person as the issue. While there are many methods for collaborative communications, several common tools to foster the collaboration include consensus decision-making, A3s, Daily Huddles and similar problem solving activities.

Managing your tasks and overall projects require more than placing them in a sequence and attaching specific timelines to them. You need to adopt a better way to make your workflow transparent so you can continuously optimize your process and evolve it to create superior value for your customers.


Subscribe to my feed Subscribe via Email LinkedIn Group Facebook Page @TimALeanJourney YouTube Channel SlideShare

Wednesday, March 13, 2019

Visual Management Boards: Manual vs Digital


When it comes to visual boards in the workplace the most common line of questioning is related to manual visuals versus computerized/digital visuals.  Many people prefer the look of a more sophisticated information technology solution over a simple hand written solution.  There are several things to consider when deciding which visual method to use.

Manual Visual
Digital Visual
Timeliness
Manual visuals are current as of the last recording and reviewed by frequency of the pitch.
Computerized visuals are current as of the last data entry and last time the report was run.
Proximity
Hand written visuals are usually close to the process whose performance they reflect.  This also makes it difficult to disperse the information to other locations.
Computerized systems encourage managing the production process from a computer screen in an office somewhere removed from the actual production area.  A computer aided solution is definitely advantageous for computational accuracy as well as ease of distributing information.
Accuracy
Manual visuals are usually near or at the Gemba and can be physically verified but humans do make mistakes.

Digital visuals are usually a long way from the source, often require judgment and execution of data, which can make accuracy difficult to assess.
Precision
Manual methods are not always precise, notes sometimes vague, and reporting periods can occasionally be missed.
Digital visuals are highly precise regardless of accuracy.

Flexibility
Questions prompted by manual visuals can be addressed at least initially where it is posted and can be easily modified or new visuals created.
Computerized solutions are powerful analytical tools, but usually only designed to address the questions programmed and not easily changed or customized.
Expense
Manual visuals require little to no expense to implement and maintain.
Computers and network equipment are expensive to purchase, require continuing maintenance costs, and technical expertise.
Responsi-veness
Manual visuals are easy to use, owned by production floor, and draws people to the information whom helped create it.
Computers can be intimidating; the data is removed from shop floor to be transformed into impersonal computer-generated report.

Manual boards work best for local teams and smaller teams, for whom the manual updates won’t waste time or cause communication breakdowns. You have to make sure that you have firm communication strategies in place so that no task gets overlooked, and that task status is always up to date. Manual boards tend to promote face-to-face conversation. Manual boards are often more intuitive than digital boards for new employees, because a physical, hand-written board can be easier to visualize and understand. Ultimately, manual boards engrain task status and other project information by forcing team members to make manual updates.

You can also create a digital board to manage your business. The benefits of a digital board include live updates, customization, and more flexibility (this is helpful in the event of changing deliverables or deadlines). Additionally, many online tools make it easy to aggregate information by letting you attach documentation directly to the board. Digital boards tend to work well for software/technology teams, fast-paced teams, teams with remote workers, or instances where external stakeholders (management, clients) need insight into progress. Although digital boards can ease some of the hurdles felt by physical board users, a digital board will not automatically solve all your team’s communication problems. Rather, maintaining the daily management and prioritizing communication among workers is the best way to ensure that everything gets completed.

Visual boards are a means connect people to their processes.  They also reflect the adherence to the process and are the basis for comparing actual versus expected performance. Visual controls help transform the abstract concept of discipline in lean management into directly observable, concrete practices.  It is important to choose the right visual format for each process. 


Neither option is objectively better suited to Lean methodology. Instead, your board will be most effective if you choose the version that best fits the needs of your team. For instance, if your team is new to Lean and is all in one location, a physical board might be best to help ease into the workflow and promote conversation among workers. On the other hand, if you’re working with a large, remote team, an online tool will work better. Therefore, the first step in implementing visual management is isolating the unique needs, strengths, and weaknesses of your team before selecting how you will organize and track the work being done.

Subscribe to my feed Subscribe via Email LinkedIn Group Facebook Page @TimALeanJourney YouTube Channel SlideShare

Wednesday, December 9, 2015

Guest Post: How To Use Lean Visuals To Improve Performance

Today I am pleased to bring you an article from Mike Pedro, who blogs at Magnatag. Mike's shares 3 key ways to make the most of your Lean visuals from personal experience. A visual workplace supports employee engagement and continuous improvement.


Implementing lean visuals into your organization is one of the best things you can do to improve and motivate your team’s performance.  Visuals keep everyone on your team informed and thereby involved with daily operations. Gwendolyn Galsworth, an expert in lean visualization, says that the visual workplace is more than just surrounding ourselves with posters and signs, its about making the language of lean production visual. In her article, “The value of vision: the language of lean production is self-ordering and self-improving”, Galsworth elaborates upon this idea further, stating:

“A visual workplace is a self-ordering, self-explaining, self-regulating, and self-improving work environment where what is supposed to happen happens on time, every time, because of visual devices… There is one simple reason why a visual workplace is needed: People have too many questions”.

So you may be asking yourself, “If the purpose of utilizing lean visuals is to inform and motivate my employees, how can I ensure its working?” In an attempt to answer this question, we’ll cover some tried-and-true methods that can help you make the most of your lean visual system.

Keep visuals as close to their point of use as possible

Lean visuals are designed to be precise, coherent, and motivating. Yet if we fail to implement these indicators properly, their value quickly diminishes. Lean visuals should always be placed in an area that makes sense to your employees; if you plan to implement a safety display board within your production facility, you should display it in an area that sees a lot of traffic throughout the day. Employees will now engage with the board, thus creating a collaborative effort to keep your workplace safe. I’ve seen far too many safety managers simply tuck a safety display board within their own office—that simply does not work. Sure, it may be a nice visual indicator to have at your convenience, but it fails to be an active tool for engagement with your staff.

Ensure that your entire workforce is on board

If there was ever a surefire way to ensure the success of a lean manufacturing movement, this would have to be it. Leading a successful charge in lean production starts with employee engagement—you have to be able to establish a connection between management and employees—without that, you’re destined for failure. Leadership is truly fundamental when implementing a lean program. Perhaps the best way to establish this connection is by hosting a company meeting, laying out the foundation of your lean process, and allowing employees to express their questions and concerns. In turn, you may find dialogue open up in regards to the types of programs you are implementing, providing you with a more profound understanding of what needs to be done to guarantee the success of your lean process.

Set up a strong list of goals

Having lean visuals in your production facility is great, but you must have an idea of what purpose they will serve. The ultimate goal of implementing a lean program within your production facility is to improve upon company costs and manufacturing efficiency.  Setting up goals for your team not only provides you with an idea of how your lean program is preforming, but also serves as a motivating factor for every member of your team. Here’s a tip on setting up goals for lean production; your goals should always be believable, measurable, challenging, and set within a deadline.

The key to making the most out of you lean visuals isn’t having the best looking image or even having the highest-rated display board at your disposal—it’s all about preparedness. If you are not ready to implement a lean system in your factory, there is a strong likelihood that the processes wont succeed. Implementing a lean way of thinking into your production facility should be treated with extreme caution. If done poorly, a failed attempt at creating a lean environment could prove to be demoralizing step backwards for your company. So I urge you to precede with caution my friend; the journey into lean is one that is often traveled, but difficult to master.

About the Author: Mike Pedro joined the Magnatag Visible Systems team right after graduating from St. John Fisher College. He’s an expert when it comes to the ins and outs of scheduling, communication, productivity and lean visuals. He is also editor of Magnatag Insight (www.magnatag.com/blog).


Subscribe to my feed Subscribe via Email LinkedIn Group Facebook Page @TimALeanJourney YouTube Channel SlideShare

Wednesday, May 6, 2015

The Language of Lean is Visual


A Visual Factory is the language of the Lean production system. Without it we can’t see the wastes in our factory, which are the greatest source of potential improvements in customer service and business performance. Visuals ensure that what is supposed to happen happens on time, every time by everyone involved.

Visual Factory (or Visual Management) refers to a lean tool that results in more than just a pretty workplace. 5S is the foundation for Visual Factory specifically in the areas of cleanliness, order, and discipline, but it doesn’t stop there. However, true Visual Factory goes beyond a clean, well organized factory; it’s a company-wide “nervous system” that allows all employees to understand how they affect the factory’s overall performance.

A Visual Factory provides a clear and common understanding of goals and measures of the business. With this information employees are able to align their actions and decisions with the overall strategic direction of the company. It is also an open window to factory performance, and it provides the same unbiased information to everyone, whether owner, manager, operator, or visitor.

The goal in Visual Factory is to create a “status at a glance” in the workplace. This refers to an operating environment where anyone can enter the workplace and:
See the current situation (Self-explaining)
See the work process (Self-ordering)
See if you are ahead, behind or on schedule (Self-regulating) and
See when there is an abnormality (Self-improving)

Visual Factory techniques can be used in a variety of ways. This offers an unlimited number of opportunities creating a significant variation in the actual application of Visual Factory.

There is irrefutable evidence that a “shared vision” is critical to the success of today’s businesses. Visual Factory communicates the “shared vision” along with an understanding of how each individual should contribute toward that success.


In the game of baseball why do fans repeatedly look at the scoreboard when the action is clearly on the field? The scoreboard answers important questions about the status of the game. It tells us how our team is doing in relation to the goal, to win the game! Visual Factory is the scoreboard for our business.


Subscribe to my feed Subscribe via Email LinkedIn Group Facebook Page @TimALeanJourney YouTube Channel SlideShare

Wednesday, July 2, 2014

Five Simple Ways to Make Your VSM A Valuable Improvement Tool


Value stream mapping is a tremendously valuable tool for improving a process. Well suited for a broad range of industries and processes. A value stream map (VSM) illustrates the flow of materials and information as a product or service moves through a process.

Value-stream mapping is a useful tool for grasping the current situation and for planning improvements. A current state value-stream map depicts the current situation as is. A future state value-stream map depicts what the value stream should look like after planned improvements have been implemented.

Creating a value stream map of the current state of your process helps you focus on areas of waste such as excess inventory, non-value-added time, and multiple operators. It’s not an easy undertaking, but making a good value stream map is a great way to help everyone involved understand and see where improvements can be made.

There is a tendency to skip mapping the current state and go directly to the future state map. But if we don’t understand the current process, we can’t really make intelligent decisions about how the future current state might or should look. A lot of companies want to skip the development of the current state map and get right into brainstorming ideas for improvement. We must reduce this impulse.

Skipping the current state map is like building a house without surveying the land or visiting the site.  Doing so can lead to a home that can’t be built and an upset homeowner.

These tips will help you develop accurate value stream maps that you can use to drive continuous improvement.

1. Define your value stream.
Identify the basic process steps before conducting your value stream map. Base the value stream map process on customer requirements. You must understand what the customer values, and use that as your starting point. Include all the activities required to bring a product from “raw materials” into the customer’s hands or provide service to a target audience. For each step in the process agree to the measure/data requirement needed for the map.

2. Capture the actual process in the actual place.
Describe the process as it operates now, not how it’s supposed to operate. Don’t be shy – visit the workplace when doing a value stream map. Walk through the process to ensure that the flow of materials and information is accurate. You will gain far more knowledge of the process if you witness the events yourself. An incorrect VSM can lead to wrong conclusions being drawn and can waste valuable time of improvement teams.

3. Make your value stream map with pencil and paper.
These days there are lots of value stream mapping software available but for first timers who may not be familiar with the software it’s just one extra thing to learn. Excellent results can be obtained through traditional pencil and paper. This helps your Value Stream Mapping team be familiar with the process and understand the level of detail that will be captured. When drawn in pencil it is easier to make changes. Just remember to stick with basic value stream mapping icons.

4. Analyze the entire value stream.
Too many Lean practitioners skip value stream analysis and jump right to identifying specific sources of waste and removing them. Unfortunately, as they note, this often results in local improvements, but rarely results in significant overall improvements in the overall value stream or in improved products for customers. To really have an impact, you need to begin by streamlining the entire value stream, and only after that, drill down into specific processes to eliminate waste. Your map may reveal a number of potential areas for improvement. Which ones will make the biggest difference in meeting customer requirements?

5. Map your improvement plan.
Create a future state map from the current state map. Your current-state map suggests where to focus your efforts, so you can draft a map that shows how value will flow through an improved process. List the actions that need to happen to improve the process. Take a step-by-step approach to putting your plan in action, then update your future state map as you implement each step.

Bonus: Remember keep your value stream map simple.
Remember that there is no perfect value stream map and you should set out to capture all the sufficient information. Keep the mapping process simple and allow for corrections. This will allow everyone to participate and be engaged in the improvement part of the process.

There is a lot to think about when undertaking value stream mapping so be sure not to rush. Create a check list of items that should be included in the map and cross them off as you go along. When you think you’ve got your map complete – validate it with your stakeholders – ensure its representative of what actually happens. Use this to iron out any problems with the map. Don’t take this stage for granted – get it wrong and you can find your improvement suggestions shot down in flames as stakeholders trash your map!


Subscribe to my feed Subscribe via Email LinkedIn Group Facebook Page @TimALeanJourney YouTube Channel SlideShare

Monday, October 7, 2013

The Lego Calendar, Fun and Productive Visual Management

Productivity tools and techniques have been a frequent topic of discussion here. A personal kanban has been a highlight of this topic. Recently, I came across a great video series combining a common Lean training tool, Legos, and project management kanban system. 

Last year, workers at a design studio in London recently went on a quest to find a better way to organize themselves while in the office. There were a few requirements. It had to be big. It had to cover a few months into the future. It had to work both online and offline. They settled on Legos. Using Legos, Vitamins built a large, wall-mounted calendar with flat gray pieces as the base, representing the days of the week. Each person has their own line on the calendar, and is represented by a custom minifig character. Different projects are assigned different colors of bricks. The wall-sized calendar made entirely of Lego bricks also syncs with Google automatically via smartphone screenshots.


Lego calendar by Vitamins from Vitamins on Vimeo.

This Lego calendar may be the most fun business calendar ever created. Do you see an opportunity for this approach in your business?


Subscribe to my feed Subscribe via Email LinkedIn Group Facebook Page @TimALeanJourney YouTube Channel SlideShare

Wednesday, September 4, 2013

Visual Management, A Status At A Glance


In the game of baseball why do fans repeatedly look at the scoreboard when the action is clearly on the field? The scoreboard answers important questions about the status of the game. It tells us how our team is doing in relation to the goal, to win the game! Visual management is the scoreboard for our business.

Visual management provides a clear and common understanding of goals and measures of the business. With this information employees are able to align their actions and decisions with the overall strategic direction of the company. It is also an open window to factory performance, and it provides the same unbiased information to everyone, whether owner, manager, operator, or visitor.

The goal in Visual management is to create a “status at a glance” in the workplace. This refers to an operating environment where anyone can enter the workplace and:

See the current situation (Self-explaining)
See the work process (Self-ordering)
See if you are ahead, behind or on schedule (Self-regulating) and
See when there is an abnormality (Self-improving)

Visual management is the language of the Lean production system. The Gemba is about observation and our observation is greatly enhanced by the ability to see the “status at a glance.” Without it we can’t see the wastes in our factory, which are the greatest source of potential improvements in customer service and business performance. Visuals ensure that what is supposed to happen happens on time, every time by everyone involved.

The key objectives of visual management are:

Give the status (Indicator Lights)
Direct and locate things (Road signs)
Indicate actions (Traffic Lights)
Show what is right or wrong (Lines in parking lots)

Although each tool has a different objective, the goal of all visual management tools is the same:  Status at a Glance.  For a leader, especially a leader in an organization that is on the pathway to a Lean transformation, visual management is one of the most fundamental and necessary elements to success. 

There is irrefutable evidence that a “shared vision” is critical to the success of today’s businesses. Visual management communicates the “shared vision” along with an understanding of how each individual should contribute toward that success. It’s a company-wide “nervous system” that allows all employees to understand how they affect the factory’s overall performance. 


Subscribe to my feed Subscribe via Email LinkedIn Group Facebook Page @TimALeanJourney YouTube Channel SlideShare